Liquidity Zones — Free Download & Guide
AD SLOT · 728×90
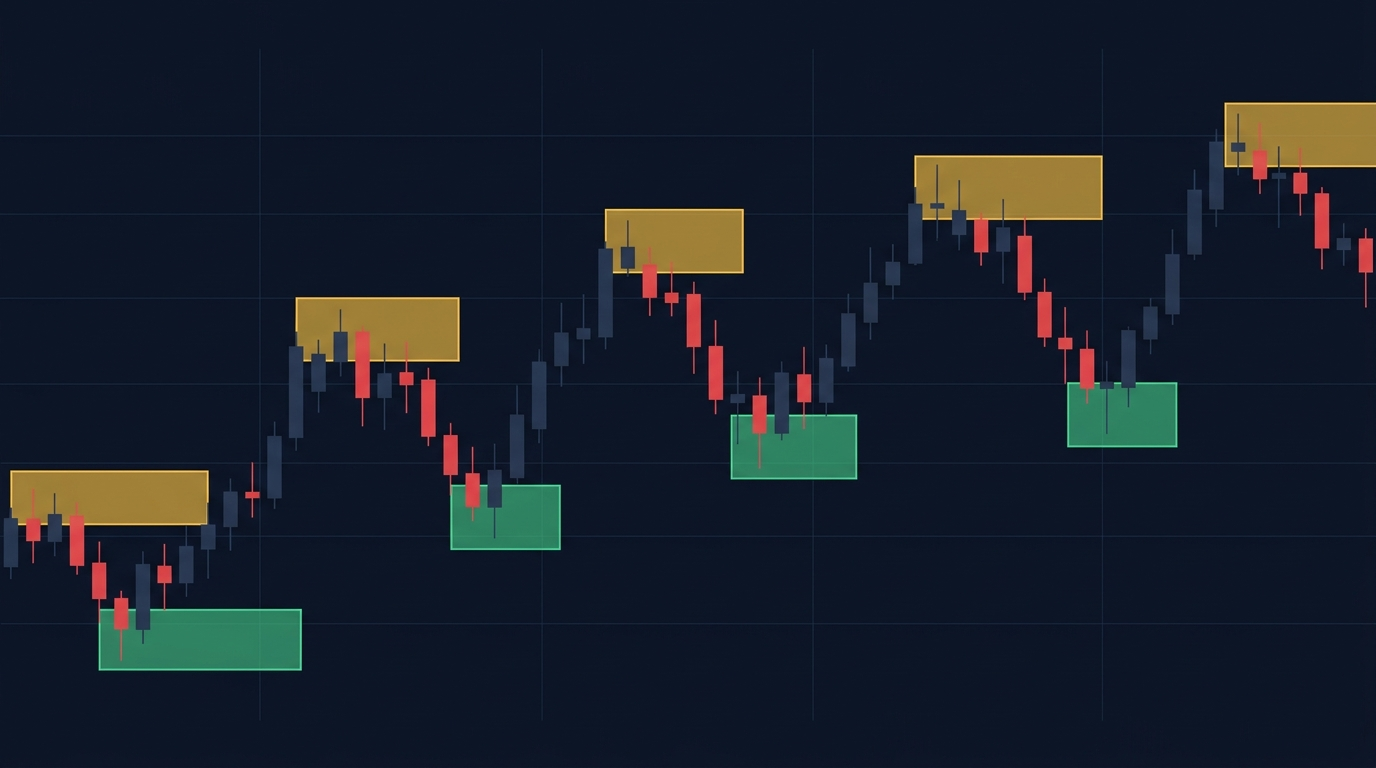
Liquidity Zones marks where resting liquidity sits: recent swing highs (sell-side) and swing lows (buy-side) as horizontal levels, plus the previous day's high and low. It uses confirmed fractal swings on closed bars, so levels do not repaint once drawn.
What it does
- Plots swing-high (sell-side) and swing-low (buy-side) levels
- Adds previous-day high/low reference lines
- Repaint-free — only confirmed swings are drawn
- Configurable swing strength and number of levels
Key settings
| Setting | Default | Notes |
|---|---|---|
| Fractal | 2 | Bars each side for a swing |
| Lookback | 300 | Bars scanned |
| Max levels | 8 | Per side |
| Show prev day | true | Daily high/low lines |
How to install
Download the file, drop it into your MetaTrader Experts or Indicators folder, restart the platform, then drag it onto a chart (enable AutoTrading for EAs). Full walkthrough in our MT4/MT5 install guide.
Run it live: Runs on MT4 — open a demo or live account with Exness or IC Markets to test it first. (Affiliate links — see disclosure.)
Limitations to understand
These are reference areas where stops tend to cluster, not buy/sell signals. Combine them with your own entry logic.
Risk warning. Educational use only — not financial advice. No guarantee of profit, and past performance does not indicate future results. Test on a demo account first; you can lose more than your deposit trading leveraged products.